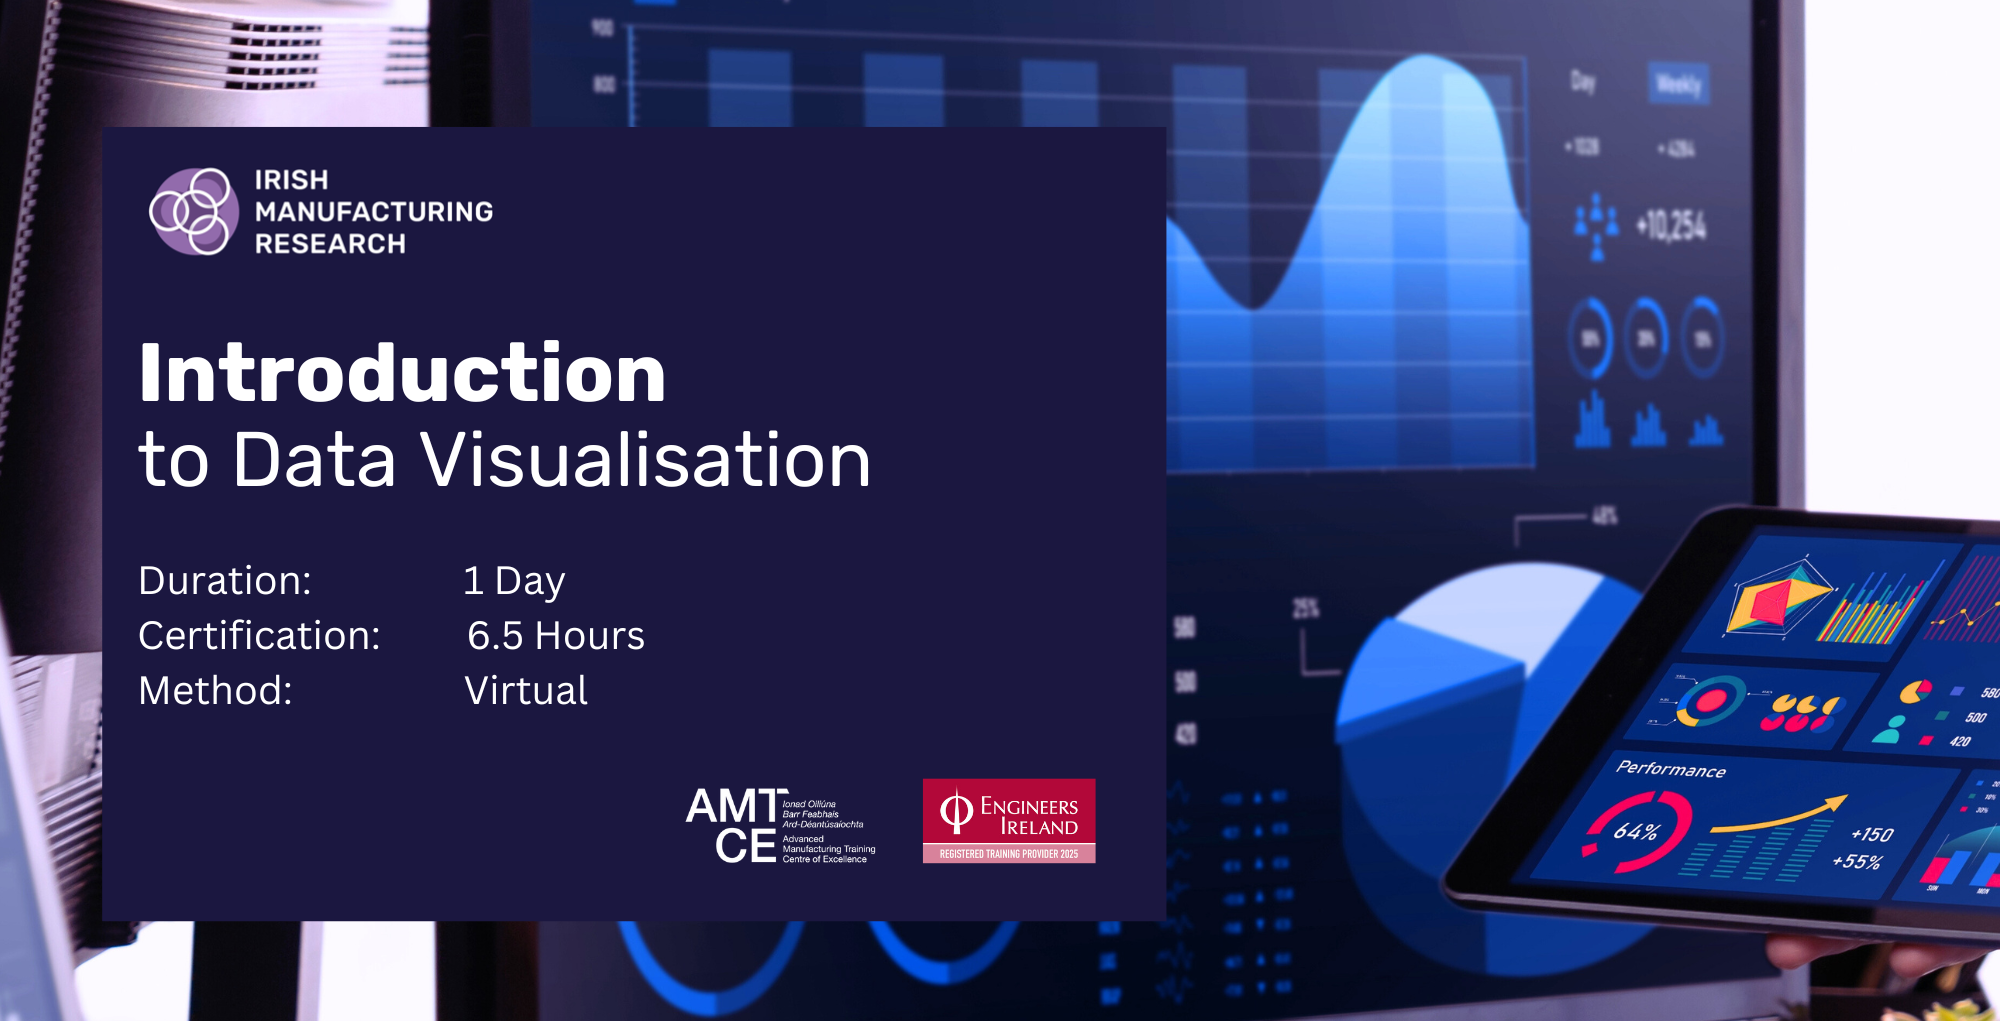
Introduction to Data Visualisation
Transform complex data into actionable insights to enable data driven decision making.
Course Aim
This course covers data visualisation at a glance, with practical hands-on module (using a data visualisation software).
At the end of this course, we expect the audience to be able to know, understand and be familiar with data visualisation, including the history, values, challenges, most common software to use, and the implementation to transform complex data into actionable insights.
Overview
At the end of this course, we expect the audience to be able to know, understand and be familiar with:
a) The historical perspective of Data Visualisation;
b) The value that Data Visualisation offers to analytics;c) What makes a good design for data representation;
d) Common mistakes to avoid;
e) How to perform basic data visualisation in PowerBI or Tableau
f) Storytelling with data.
Target Audience
This course targets an audience with no or limited experience in data visualisation. It is suitable for professionals interested in learning how to best visualise data and create charts in a business intelligence platform (Tableau or PowerBI).
Course Details
- Date: Register your interest to be notified of next course date
- Duration: 1 day
- Time: 9.30 AM - 5 PM
- Method: Virtual
- Course outline: Available by request.
Learning Outcomes
Learners will be able to transform complex data into actionable insights to enable data driven decision making through effective data visualisation.
Facilitators Profile

Veena Grace Thomas
Veena Grace is IMR's Industrial Analyst Researcher and has a strong foundation in Applied Mathematics and Statistics. She holds dual Master’s degrees in Data and Computational Science, and Data Analytics.

Daugirdas Stirbys
Daugirdas Stirbys, IIoT Technologist in IMR, MSc Electronics Systems, BSc Computer Engineering. Researcher with 10 years of industrial and research experience in electronics systems, software development, sensorisation and data acquisition, and system integration.
Certification
6.5 hours CPD-Approved Engineers Ireland Accreditation.
